Session Analysis
The analysis panel on the session detail page breaks down your session into measurable categories. Each category surfaces specific metrics, thresholds, and trends so you can quickly identify strengths and areas for improvement without scrubbing through individual laps.
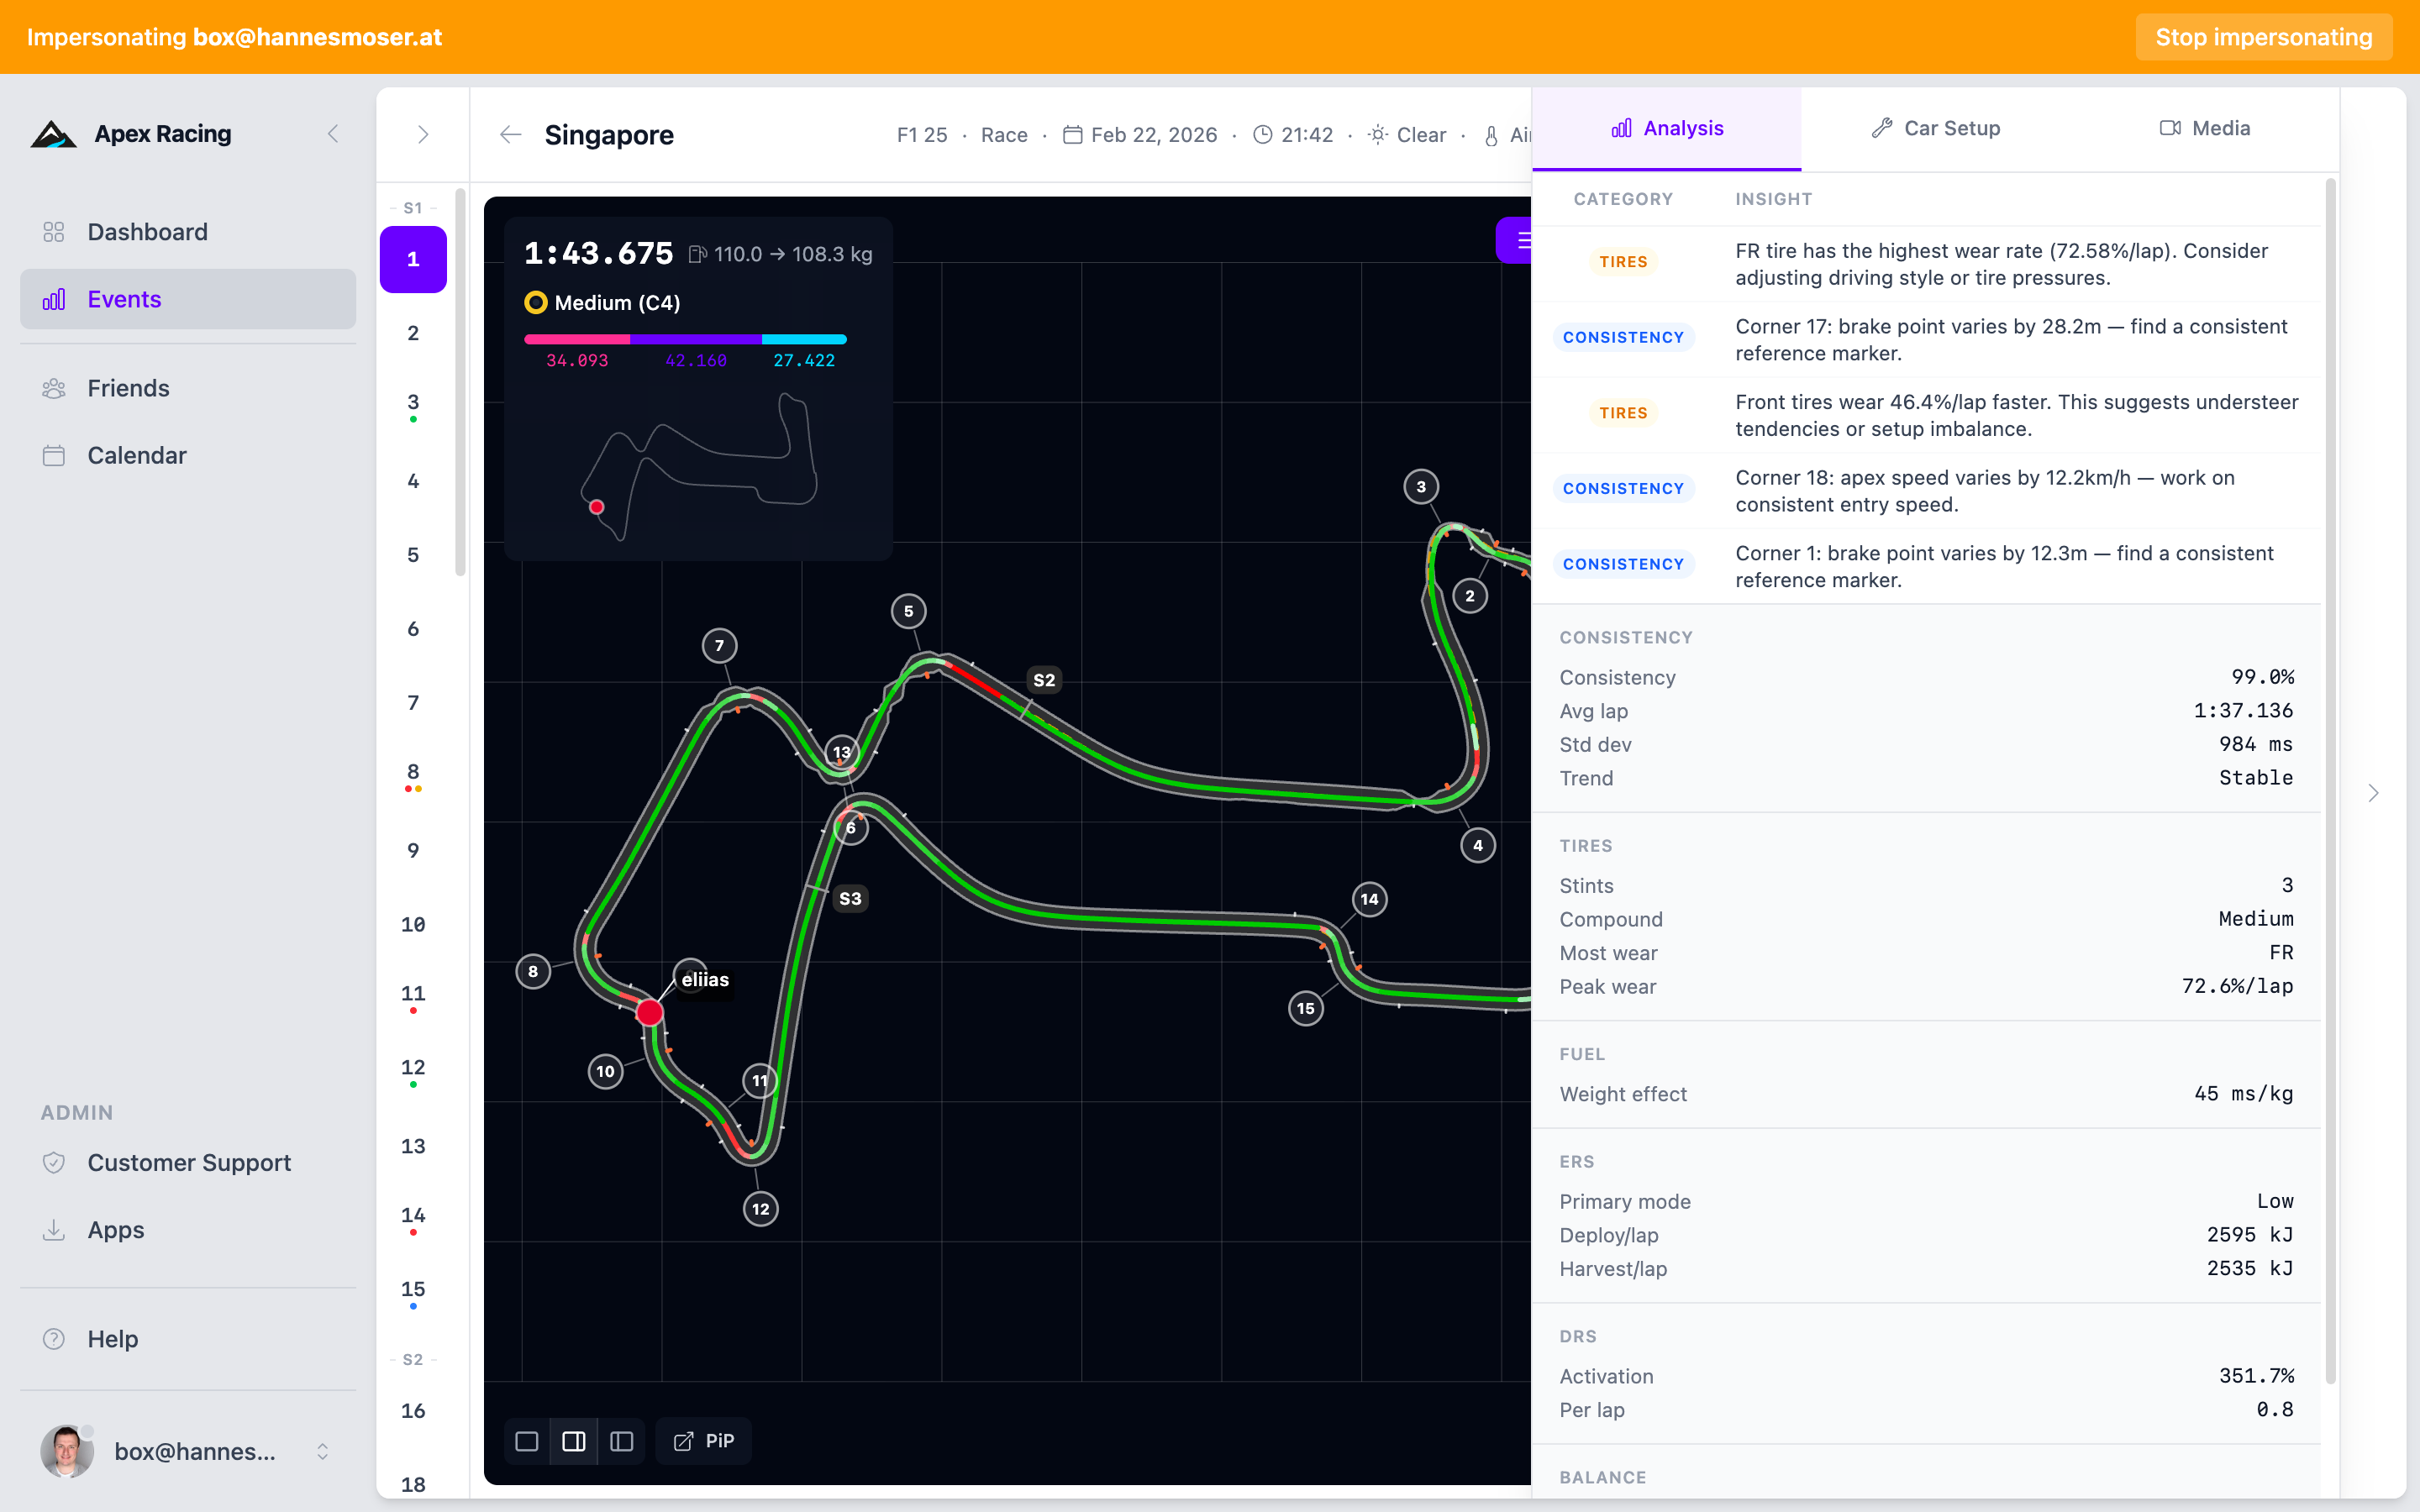
Coaching Recommendations
At the top of the analysis panel, up to five coaching insights are displayed as colored badges. These are the most actionable findings from the session, distilled into short recommendations. Badge colors indicate the category:
- Blue — consistency
- Amber — tires
- Green — fuel
- Yellow — ERS
- Purple — DRS
- Rose — setup / balance
Each badge links to the relevant section of the analysis grid for more detail.
Consistency
Consistency measures how repeatable your lap times are across the session.
How It's Calculated
The consistency percentage is calculated as (1 - standard_deviation / average_time) * 100. A higher percentage means your lap times cluster tightly around the average.
Thresholds
- 95%+ — excellent, race-ready consistency. You can place the car precisely lap after lap.
- 90-95% — good. Minor variations, likely from traffic or occasional mistakes.
- 85-90% — developing. Noticeable variation between laps, room for improvement in technique.
- Below 85% — needs focus. Large swings in lap time indicate fundamental inconsistency.
Trend Detection
The analysis detects whether your pace is trending over the session:
- Improving — lap times are getting faster (slope steeper than -200ms per lap). You're finding time as you learn the track or adapt to conditions.
- Degrading — lap times are getting slower. This is often tire wear, fuel load increase in qualifying, or fading concentration.
- Stable — consistent pace throughout. This is the goal in race conditions.
Detailed Metrics
The consistency panel also shows average time, median time, standard deviation, best lap, worst lap, and which laps were included or excluded from the calculation. Outlier laps (pit laps, first flying lap, laps with incidents) are automatically excluded.
Tire Degradation
Tire analysis tracks wear rates and temperature behavior to help you understand how your driving affects tire life.
Wear Rates
Per-wheel wear rates are calculated as percentage of tire life lost per lap.
- Less than 1%/lap — gentle. The tires will last a long stint.
- 1-2%/lap — normal. Standard degradation for most compounds and driving styles.
- 2-3%/lap — aggressive. Consider adjusting driving style (smoother inputs, less sliding) or strategy (shorter stints).
- Over 3%/lap — critical. The tires are being destroyed. This may indicate a setup problem, wrong compound, or very aggressive driving.
Key Indicators
- Worst corner — the corner with the highest contribution to overall tire wear. This is where your driving style is hardest on the tires.
- Peak wear per lap — the single highest wear reading across all four tires in any lap.
- Surface vs inner temperature differential — a gap of more than 15 degrees Celsius between surface and inner carcass temperature suggests graining risk. The tire surface is overheating relative to the core, which can cause the rubber to tear and ball up.
Fuel Management
Fuel analysis helps you plan pit strategy and understand the impact of fuel weight on performance.
Metrics
- Average consumption per lap — fuel used per lap in kilograms.
- Total fuel used — cumulative fuel consumed during the session.
- Estimated laps remaining — based on current consumption rate and remaining fuel.
- Fuel weight effect — in F1 cars, each extra kilogram of fuel costs approximately 30-40 milliseconds per lap. This means a car with a full fuel tank at the start of a race is significantly slower than the same car running on fumes at the end.
Understanding fuel weight effect helps explain why early-stint lap times are naturally slower than late-stint times, even with identical driving.
ERS (F1 Only)
Energy Recovery System analysis is available for F1 game sessions.
Metrics
- Primary deploy mode distribution — how much of the session was spent in each ERS mode (none, medium, hotlap, overtake).
- Energy deployed per lap — measured in kilojoules. How much electrical energy was used to supplement engine power.
- Energy harvested per lap — energy recovered through braking regeneration and the MGU-H.
Heavy-braking tracks naturally allow more energy harvesting. If your harvested energy is low on a track with hard braking zones, you may not be braking aggressively enough or your ERS settings may need adjustment.
DRS (F1 Only)
Drag Reduction System analysis tracks how effectively you use DRS zones.
- Activation rate — the percentage of available DRS zones where DRS was actually used. Missed activations are lost straight-line speed.
- Activations per lap — total number of DRS activations per lap.
- Missed opportunities — instances where DRS was available (within one second of the car ahead in race, or freely available in practice/qualifying) but was not activated.
Balance
The balance analysis summarizes your car's handling tendency across the session.
- Dominant tendency — understeer, oversteer, or neutral. This is determined by analyzing lateral g-force relative to steering input across all corners.
- Percentage breakdown — what percentage of corners exhibited each tendency.
- Top speed — included here because straight-line speed is directly affected by wing levels, which also influence balance.
Use the balance analysis to guide setup changes. Persistent understeer suggests reducing front wing or softening the front end. Persistent oversteer suggests the opposite.
Strategy (Race Sessions Only)
Strategy analysis is only available for race sessions and evaluates your overall race execution.
Metrics
- Grade — a letter grade (A through F) summarizing strategic execution.
- Score — a numerical score underlying the grade.
- Position flow — starting position vs finishing position, and the trajectory throughout the race.
- Pit stop timing — when you pitted, how long each stop took, and whether the timing was optimal relative to tire degradation.
- Stint breakdown — compound, lap count, and average pace for each stint.
- Safety car impact — how safety car periods affected your strategy (gained or lost positions, pit window disruption).
- Strategic insights — specific observations like "pitted one lap too early" or "undercut opportunity missed."
See Also
- Session Detail — the full session detail view where analysis lives
- Coaching Reports — detailed coaching feedback beyond the analysis grid
- Tire Data — in-depth tire temperature and wear concepts