Dashboard
The dashboard is your home base in Apex Racing. It gives you a quick overview of your recent activity and performance trends.
Best Laps
Your fastest laps are highlighted at the top, broken down by track and car combination. This lets you quickly see your personal bests and track improvement over time.
Consistency Score
The consistency score measures how repeatable your lap times are within a session. A higher score means your laps are closer together in time — a key indicator of driver skill.
The score is calculated from the standard deviation of your valid lap times, normalized to a 0–100 scale.
Trends
Performance trends show how your lap times have changed over multiple sessions on the same track/car combination. Look for:
- Downward trend — you're getting faster
- Flat trend — you've plateaued and may need to try different techniques
- Volatile trend — inconsistency, possibly from experimenting with setup or lines
Activity Heatmap
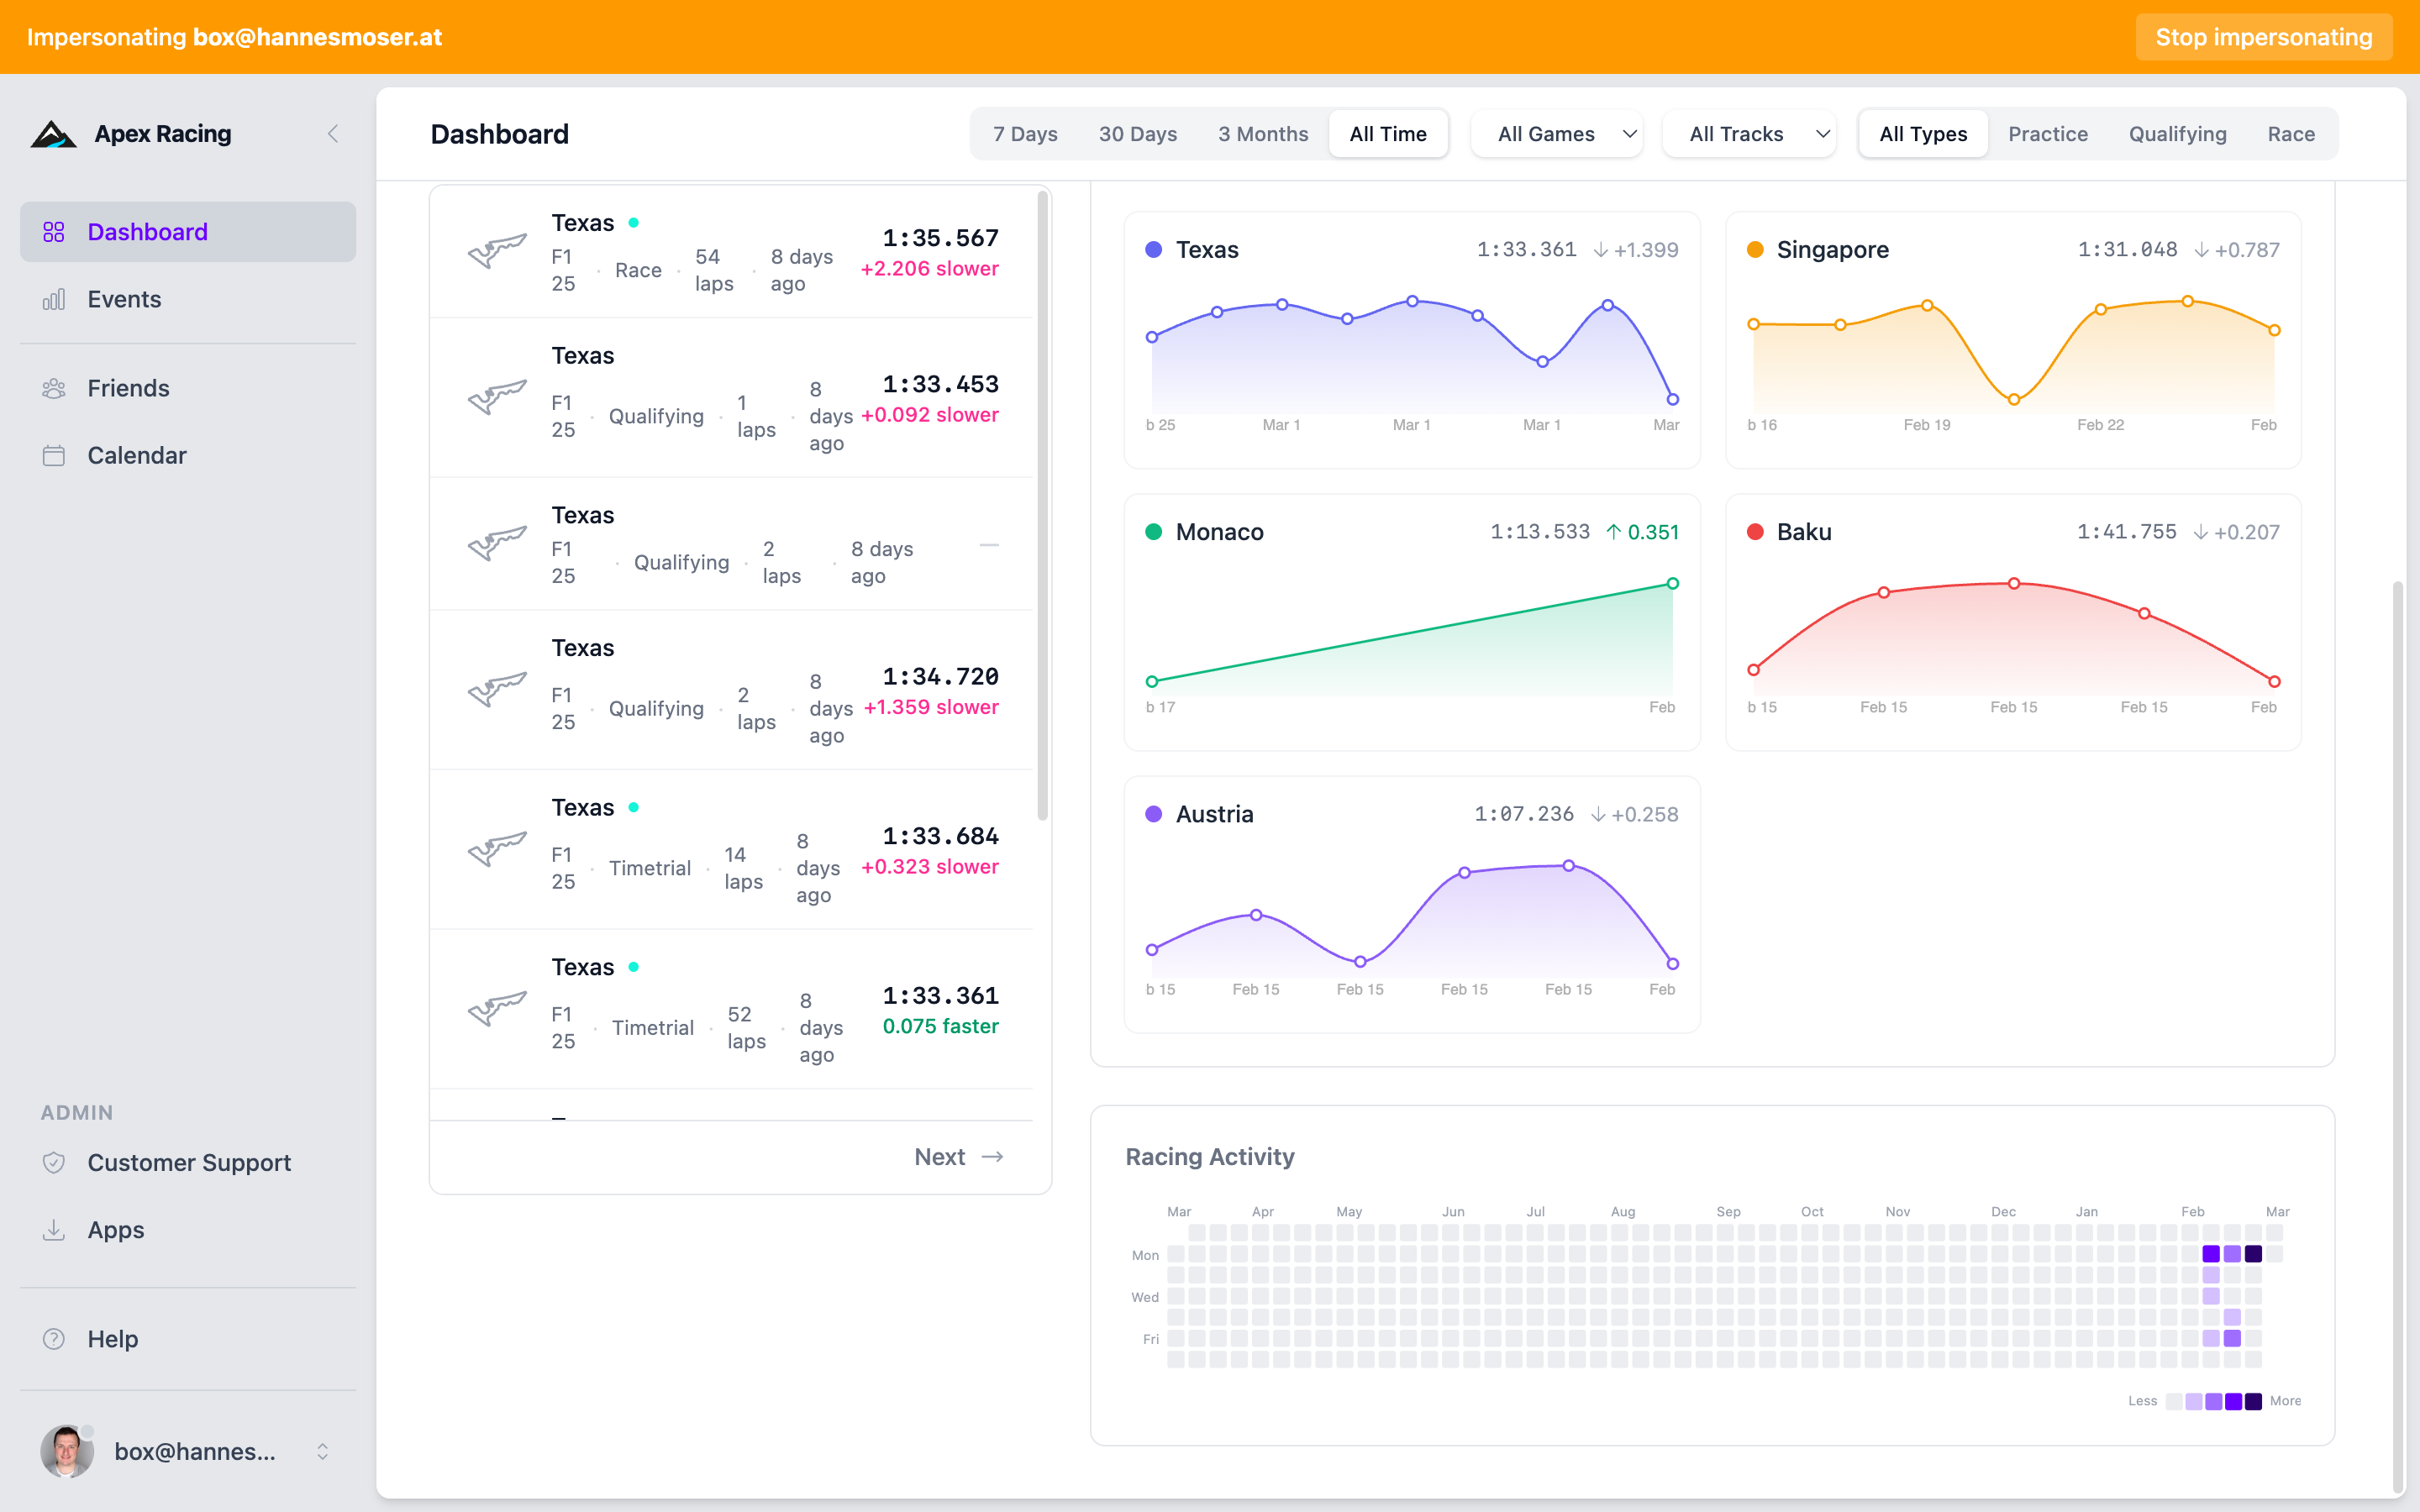
The heatmap shows your driving activity over time — similar to a GitHub contribution graph. Each cell represents a day, colored by how many laps you completed.
This helps you visualize:
- How regularly you're practicing
- Which days of the week you're most active
- Periods of high or low activity
Hero Card
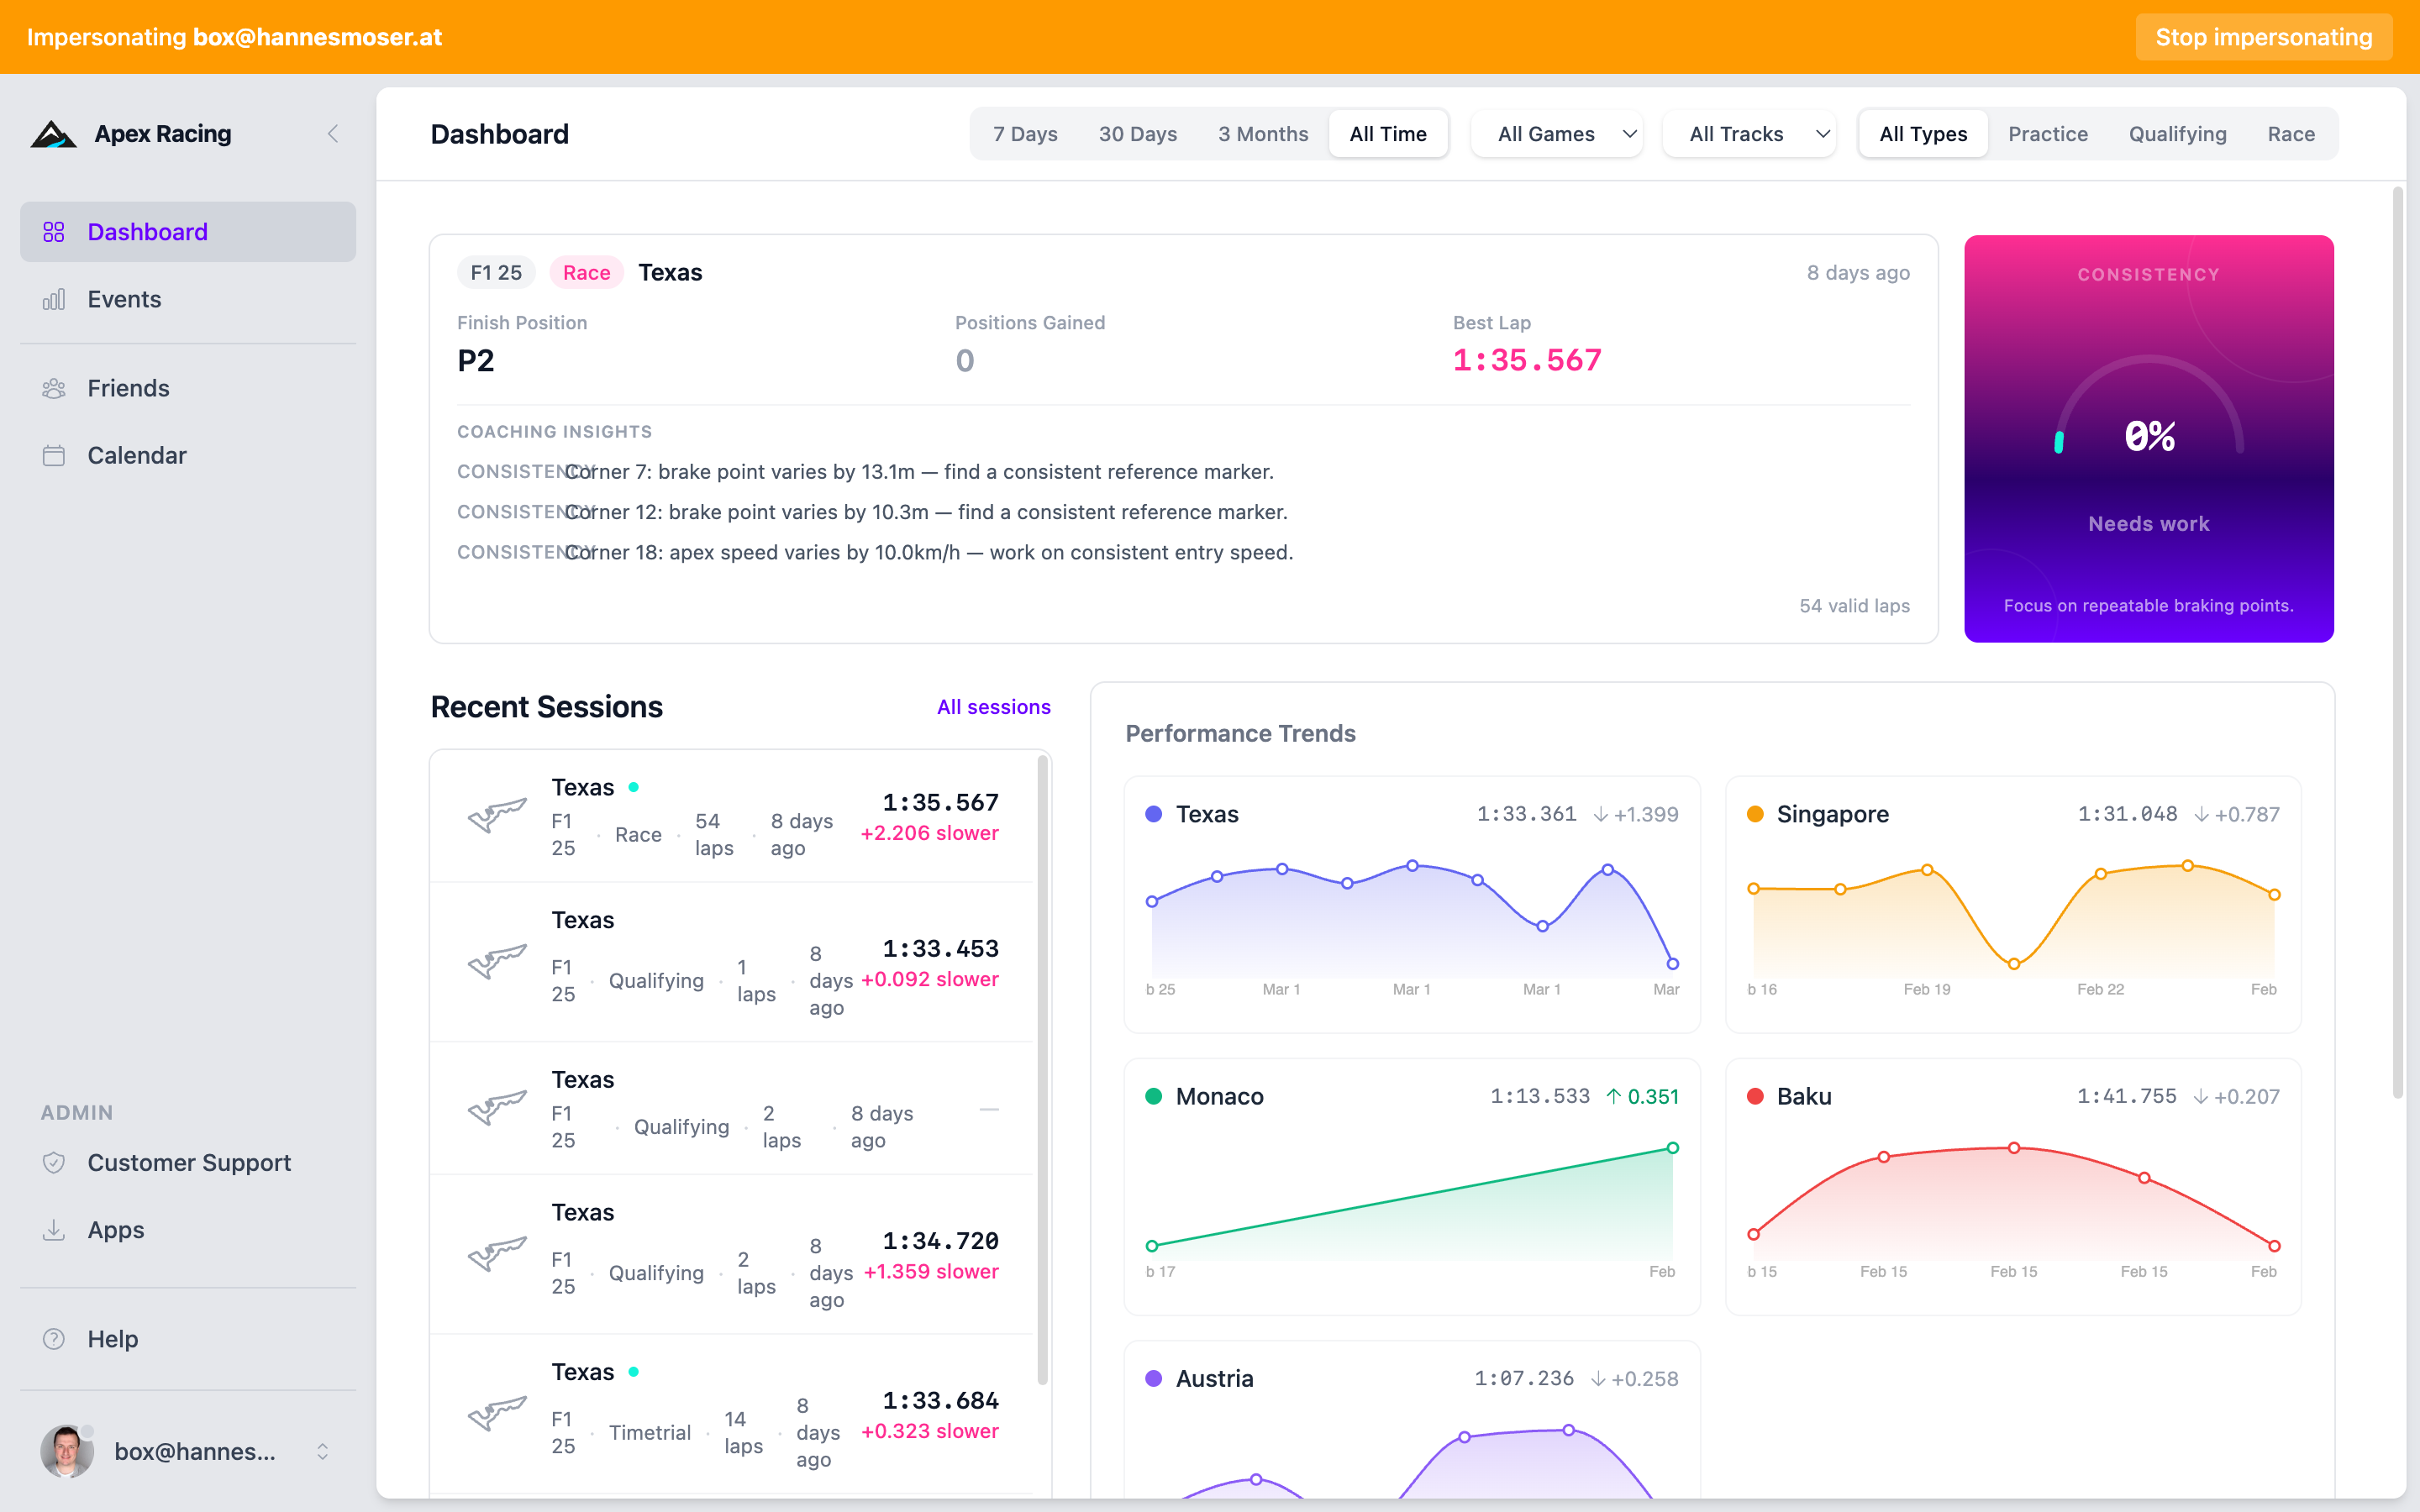
The hero card at the top of the dashboard shows your headline performance numbers:
- Best Lap — Your fastest valid lap time on your most recent track
- Average Lap — Mean of your valid laps in the session
- Theoretical Best — The sum of your best individual sector times. This is the lap you could have driven if you'd put your best sectors together. The gap between your best lap and theoretical best shows how much more is available without going faster in any single section.
Interpreting the Consistency Score
The consistency score uses the coefficient of variation (standard deviation divided by average time) on a 0–100 scale:
| Score | Rating | What It Means |
|---|---|---|
| 95%+ | Excellent | Race-ready pace. Your laps are nearly identical — a sign of a well-practiced track |
| 90–95% | Good | Solid consistency with minor variations. Focus on eliminating the occasional off-lap |
| 85–90% | Developing | Noticeable variation between laps. Identify which corners cause the biggest swings |
| Below 85% | Needs work | Large lap-to-lap differences. Focus on repeatable braking points and corner entries |
Reading Trends
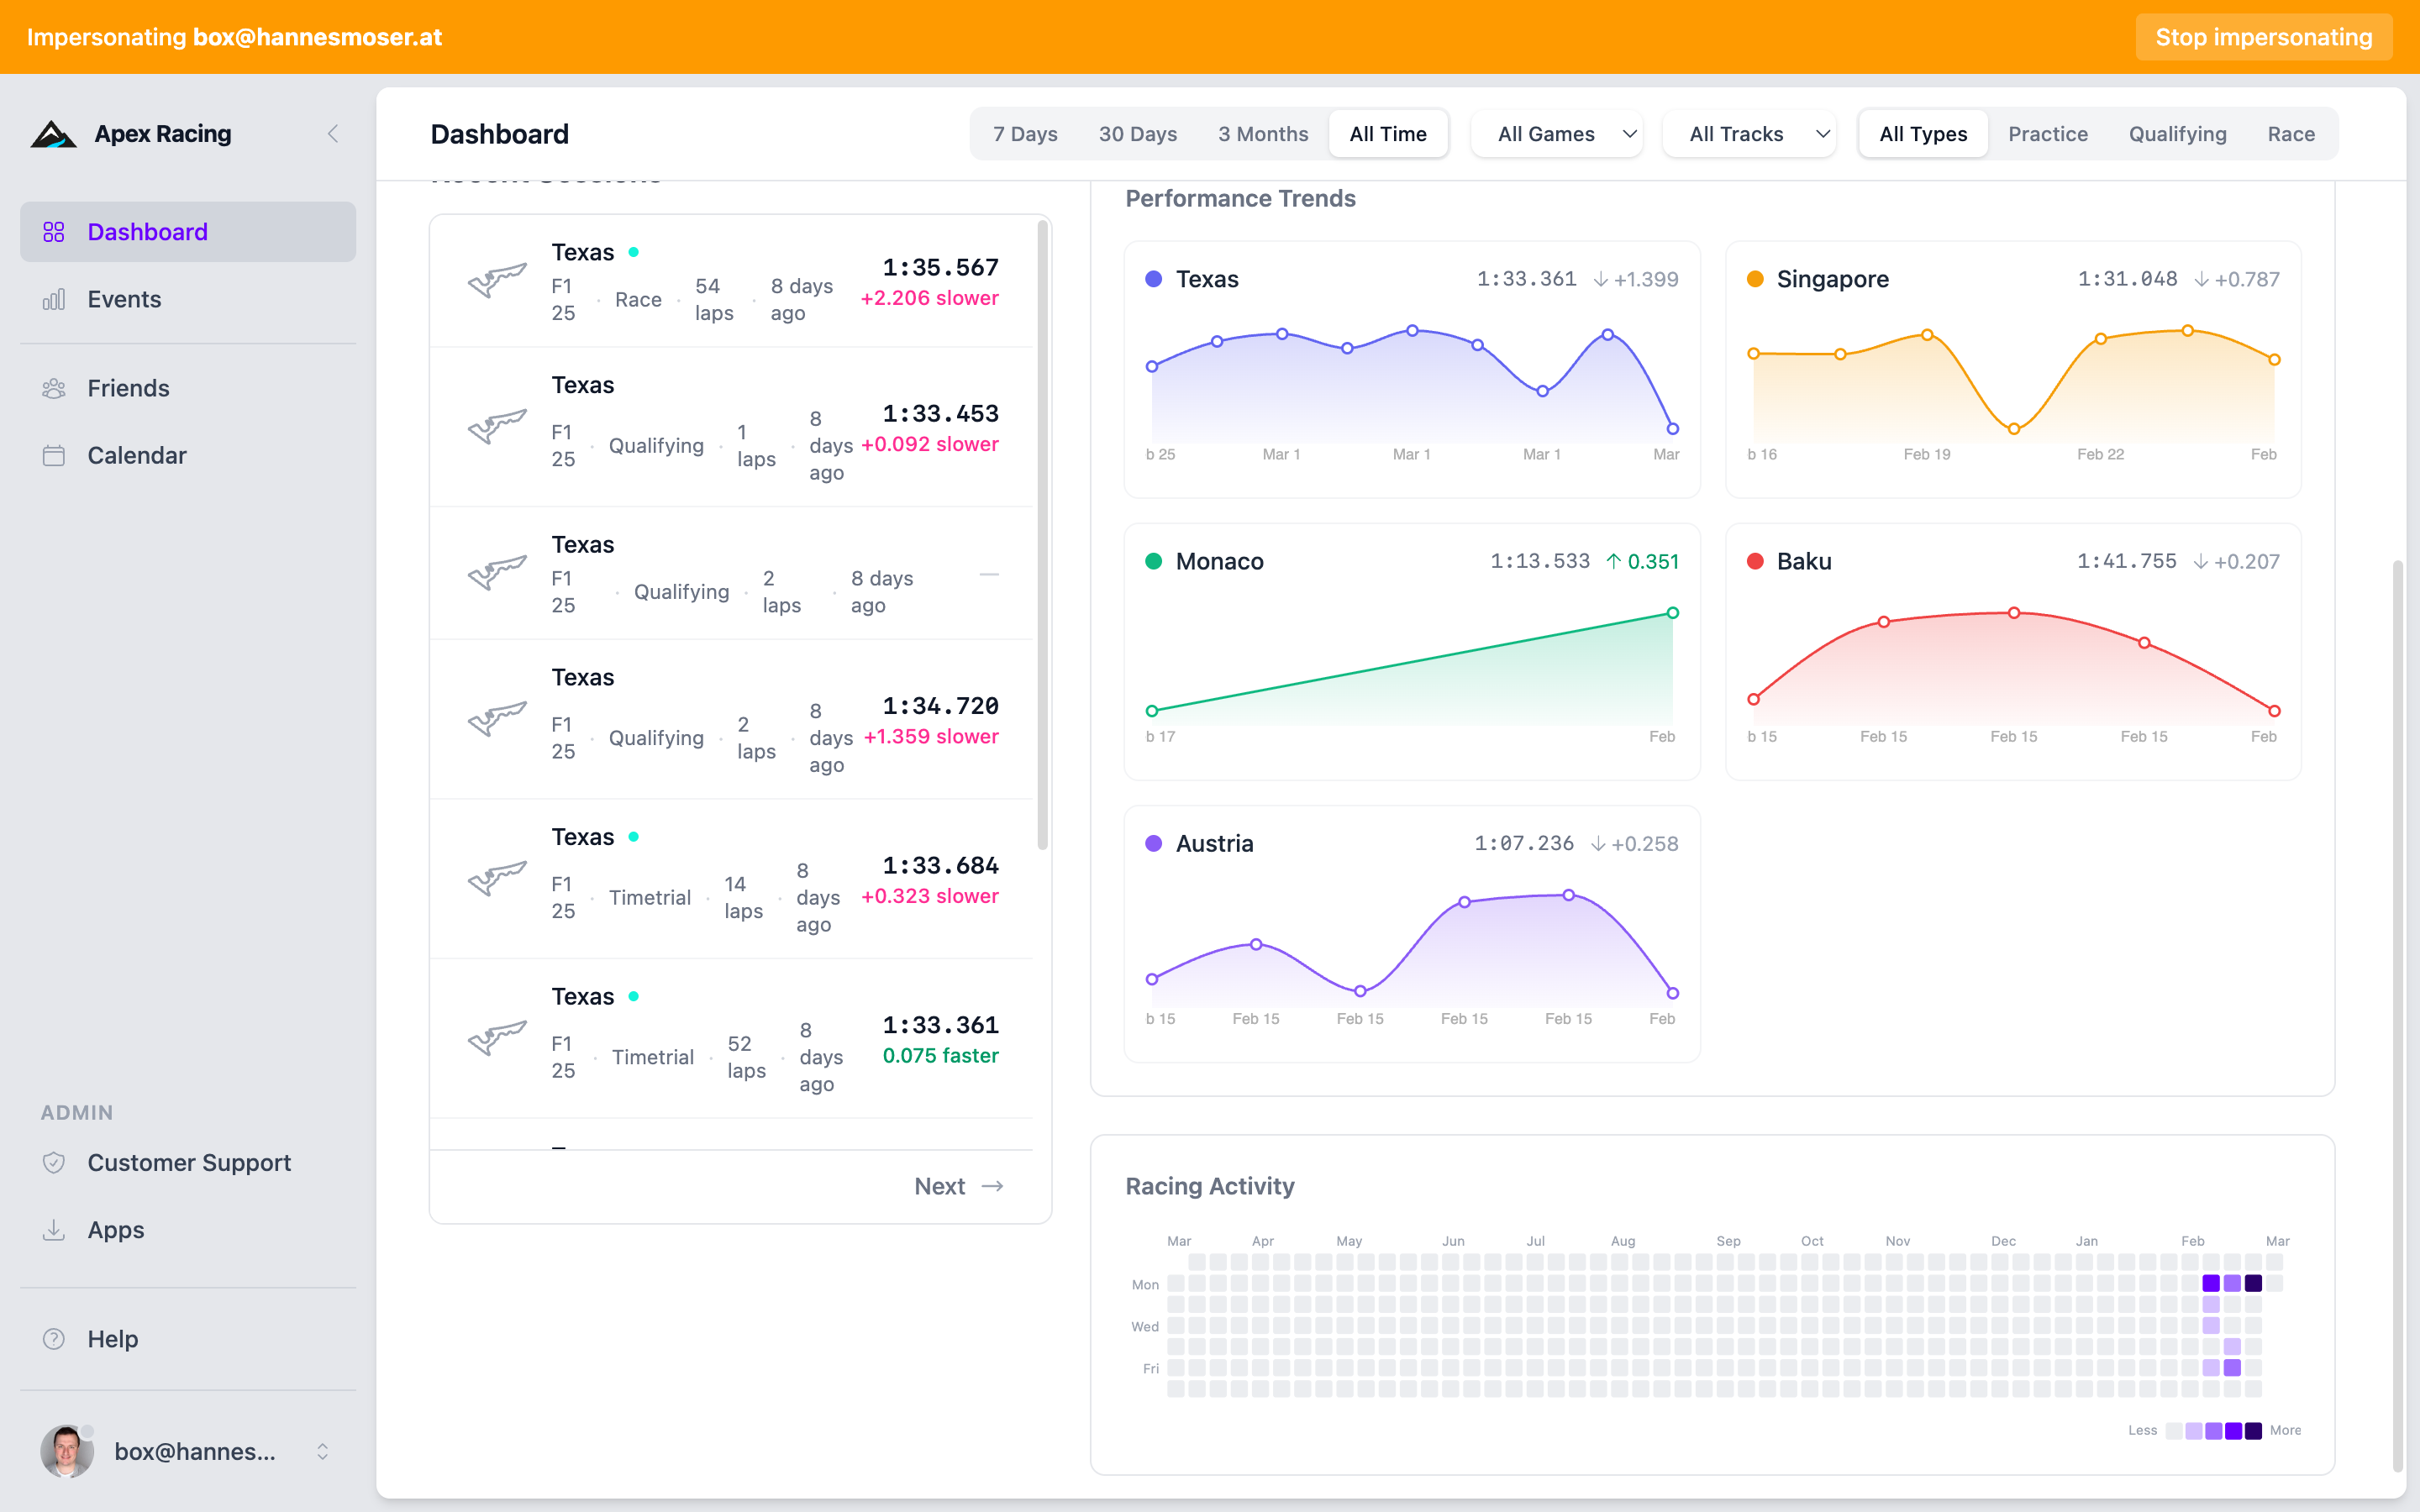
Performance trends track your progress over multiple sessions on the same track and car:
- Downward trend — You're genuinely getting faster. Look for step changes vs gradual improvement.
- Flat trend — You've plateaued. Try studying your telemetry, experiment with different lines, or compare against faster laps in the Corner Analysis.
- Volatile trend — Large session-to-session variation. This often comes from experimenting with setup or conditions changing. Not necessarily bad if you're exploring.
See also: Session Detail for diving into individual sessions